LocalStack Stack Insights
Ah, the world of CLI commands, where everyone aspires to be the commander of codes. It's a journey through syntax and semantics, packed with digital dexterity. Faster than the weekends going by and easier than reciting the alphabet backward, CLI holds the secrets of your realm, just a few words away. Creating resources becomes so easy and straightforward. What is usually hard to do using a Terminal is monitor your resources and have charts generated based on your stack’s telemetry.
Well, buckle up because what we have here is a full-blown visual Byte. We’re exploring a lesser-known instrument in the LocalStack toolbox: the web application. This isn't just your run-of-the-mill admin dashboard – oh no. On top of all the administrative things like managing your account details, subscription, etc, the web app visually interrogates your LocalStack instance on its activity and sees its every twist and turn.
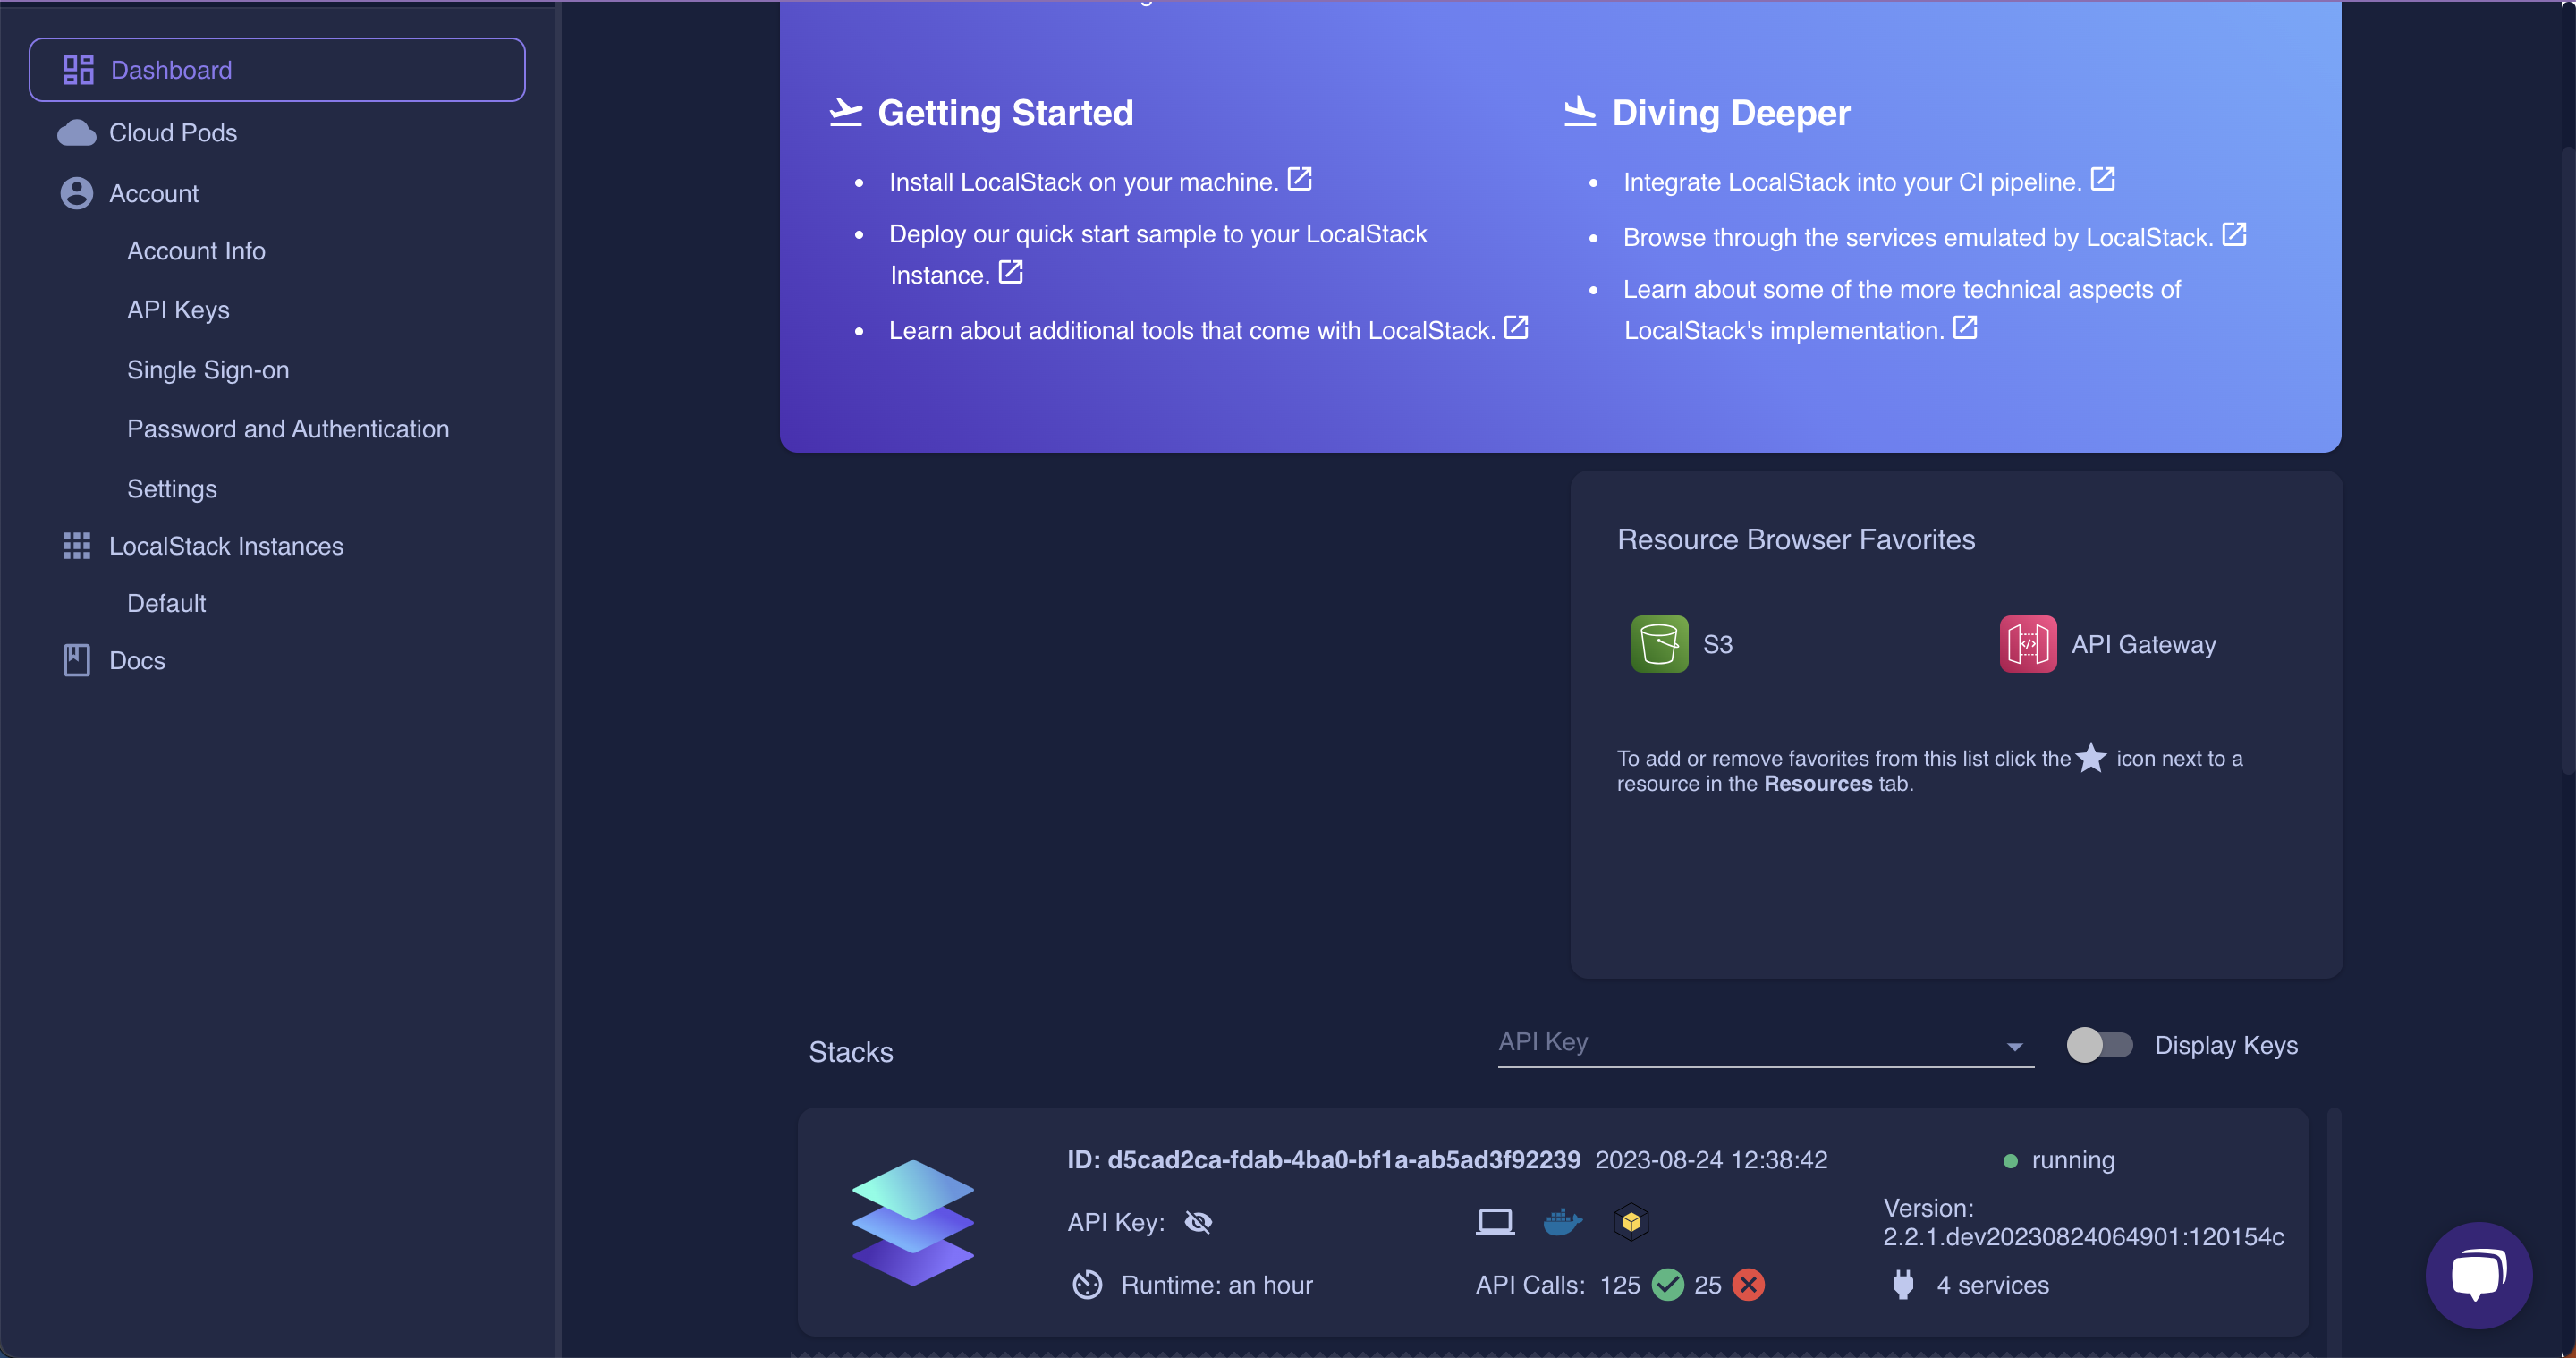
As soon as you land on the dashboard on the lower side, you can find the Stack Insights:
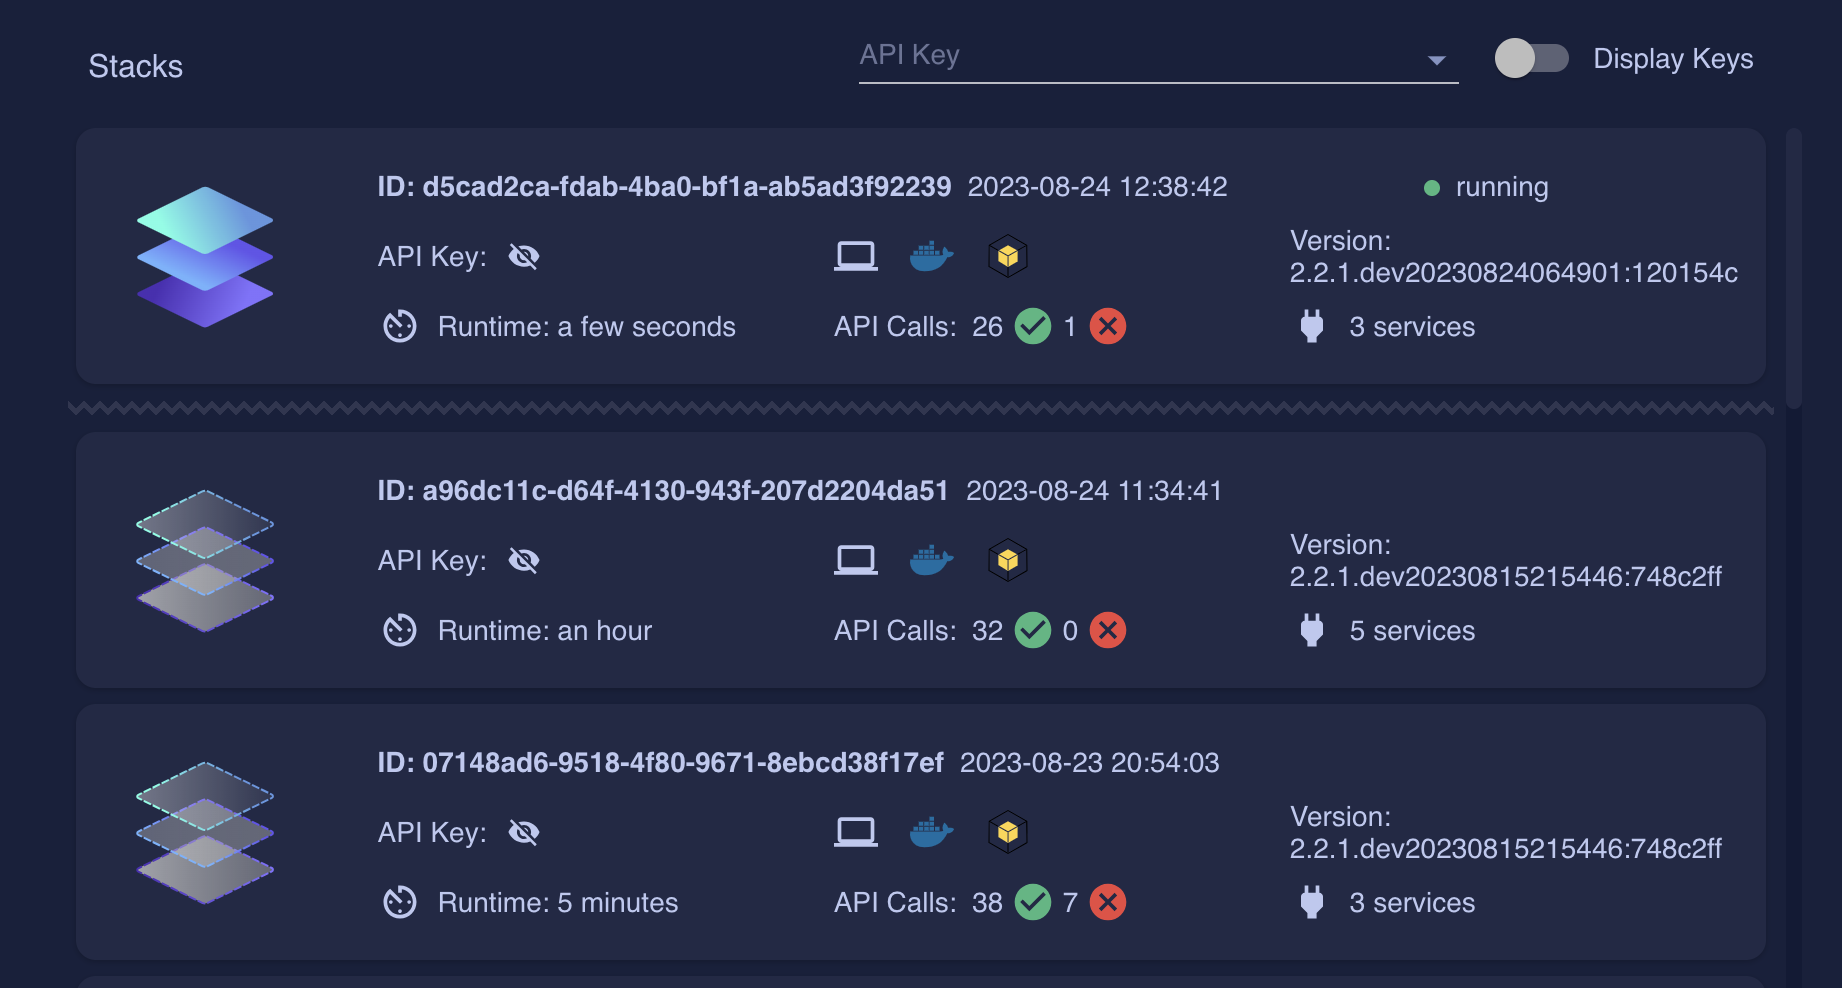
Right within your reach lies the complete history of all those LocalStack instances you've ever conjured:
We’re currently running our Stack Bytes sample application consisting of an API Gateway, two Lambdas, and an S3 bucket. When we select the active stack, we see the comprehensive charts of API calls, service invocations, and clients used for them. You’ll also have access to the full operation-per-service list where you can see their corresponding details.

Due to constant improvements, these dashboards have been optimized to use an aggregation script that aims to save ~80-90% of the traffic by bundling and sending the information. That means operations won’t show up instantly but rather after a few seconds.
Another thing to keep in mind is that invocations executed in the context of an internal API call (the case where one API uses a boto3 client to call another API internally) will not appear in these dashboards. So, in our examples, our Lambda invocations will not be present because they happen as part of the API Gateway integration.
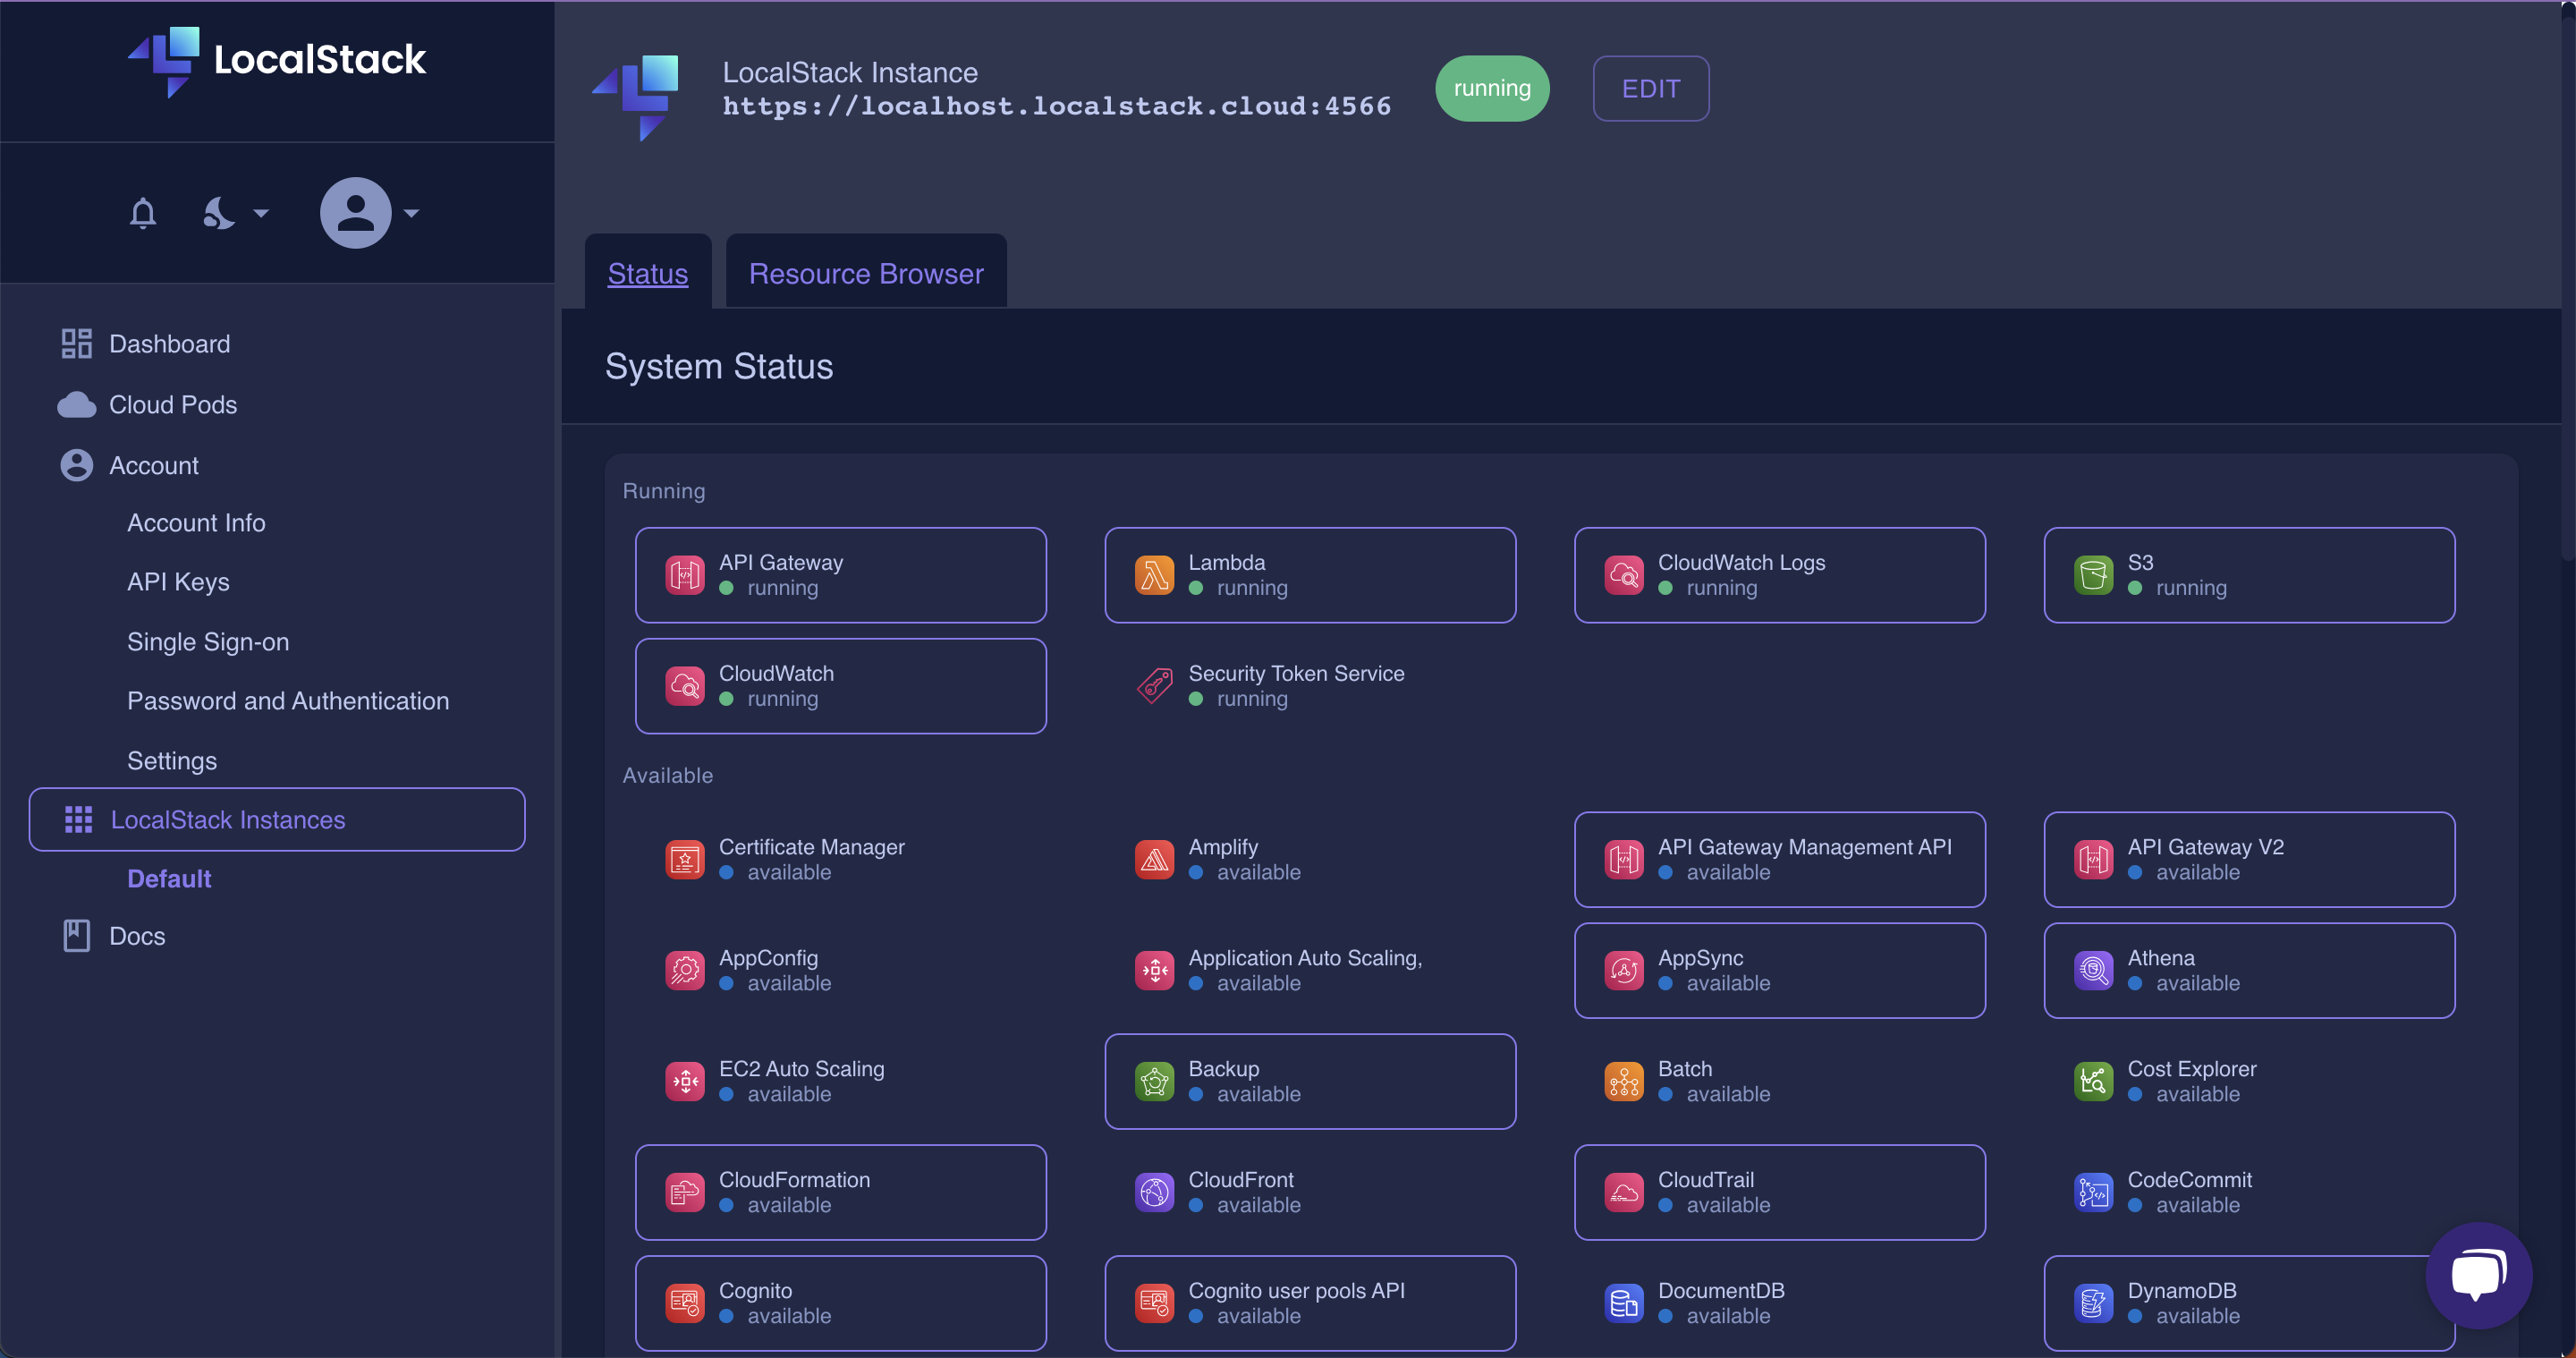
Above and beyond, let me tell you, the web app doesn't stop at that. It's also your real-time radar for all things service-related. Whether it's the availability overview or the running service status, this System Status has got you covered.
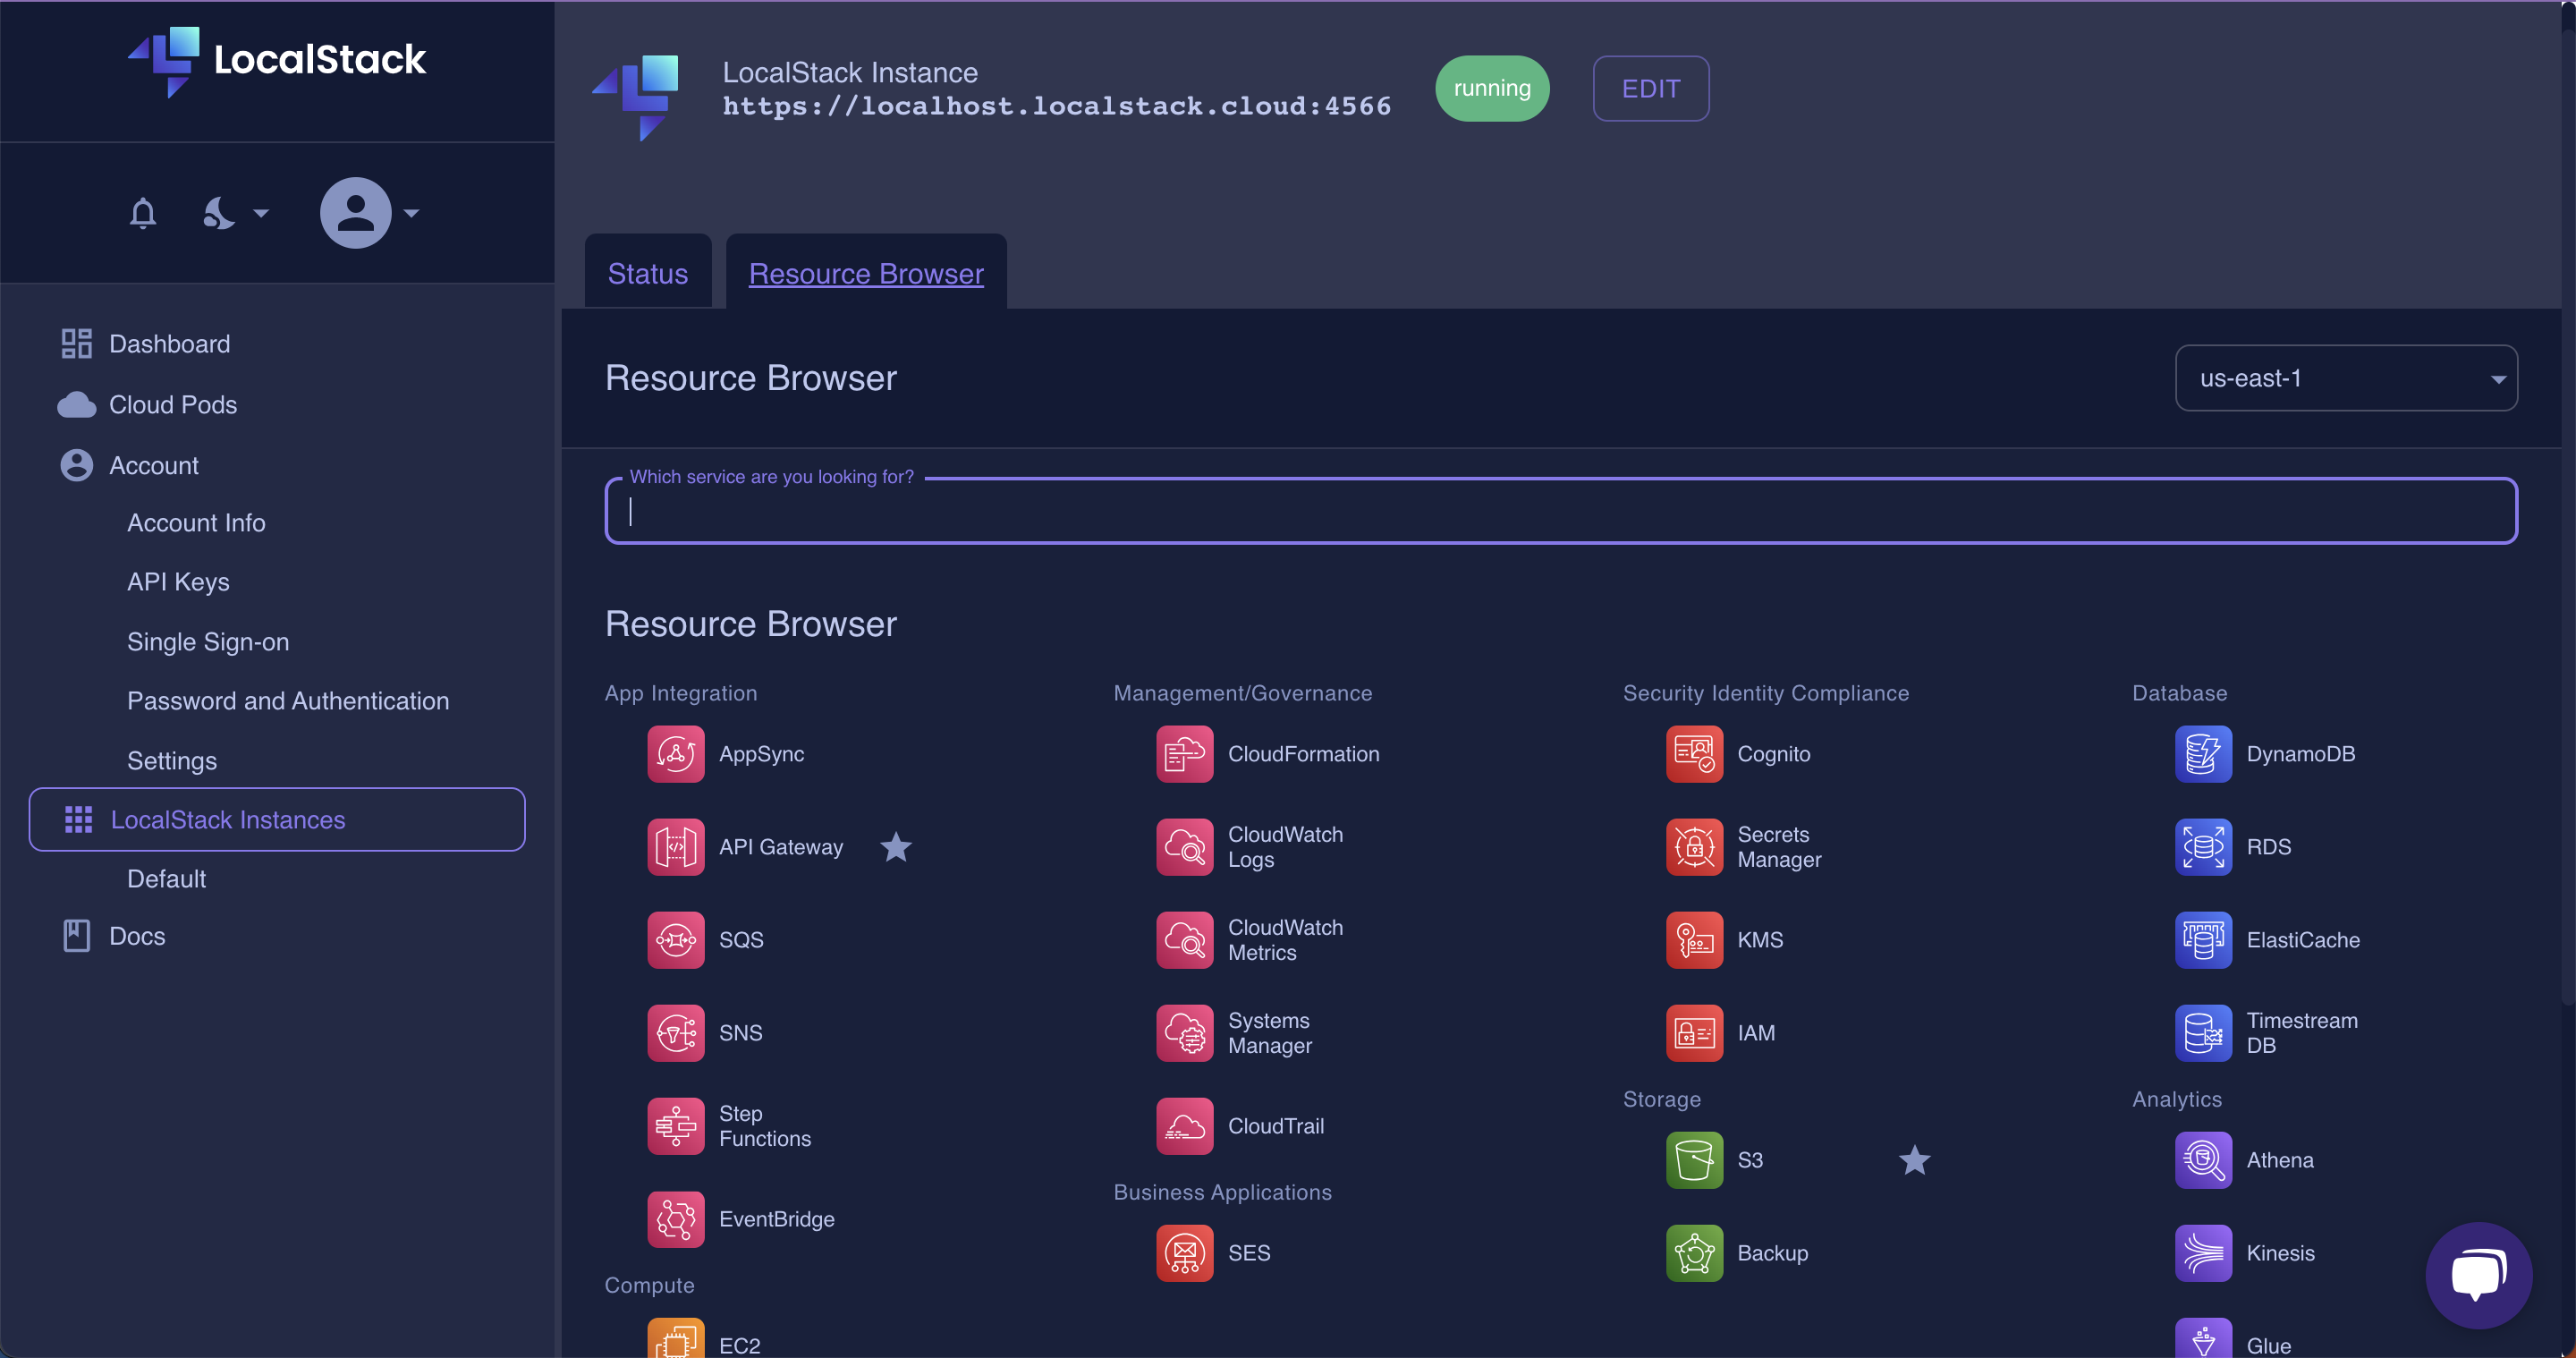
And the Resource Browser? It's like your user-friendly compass, guiding you through neatly categorized vistas of your AWS services.
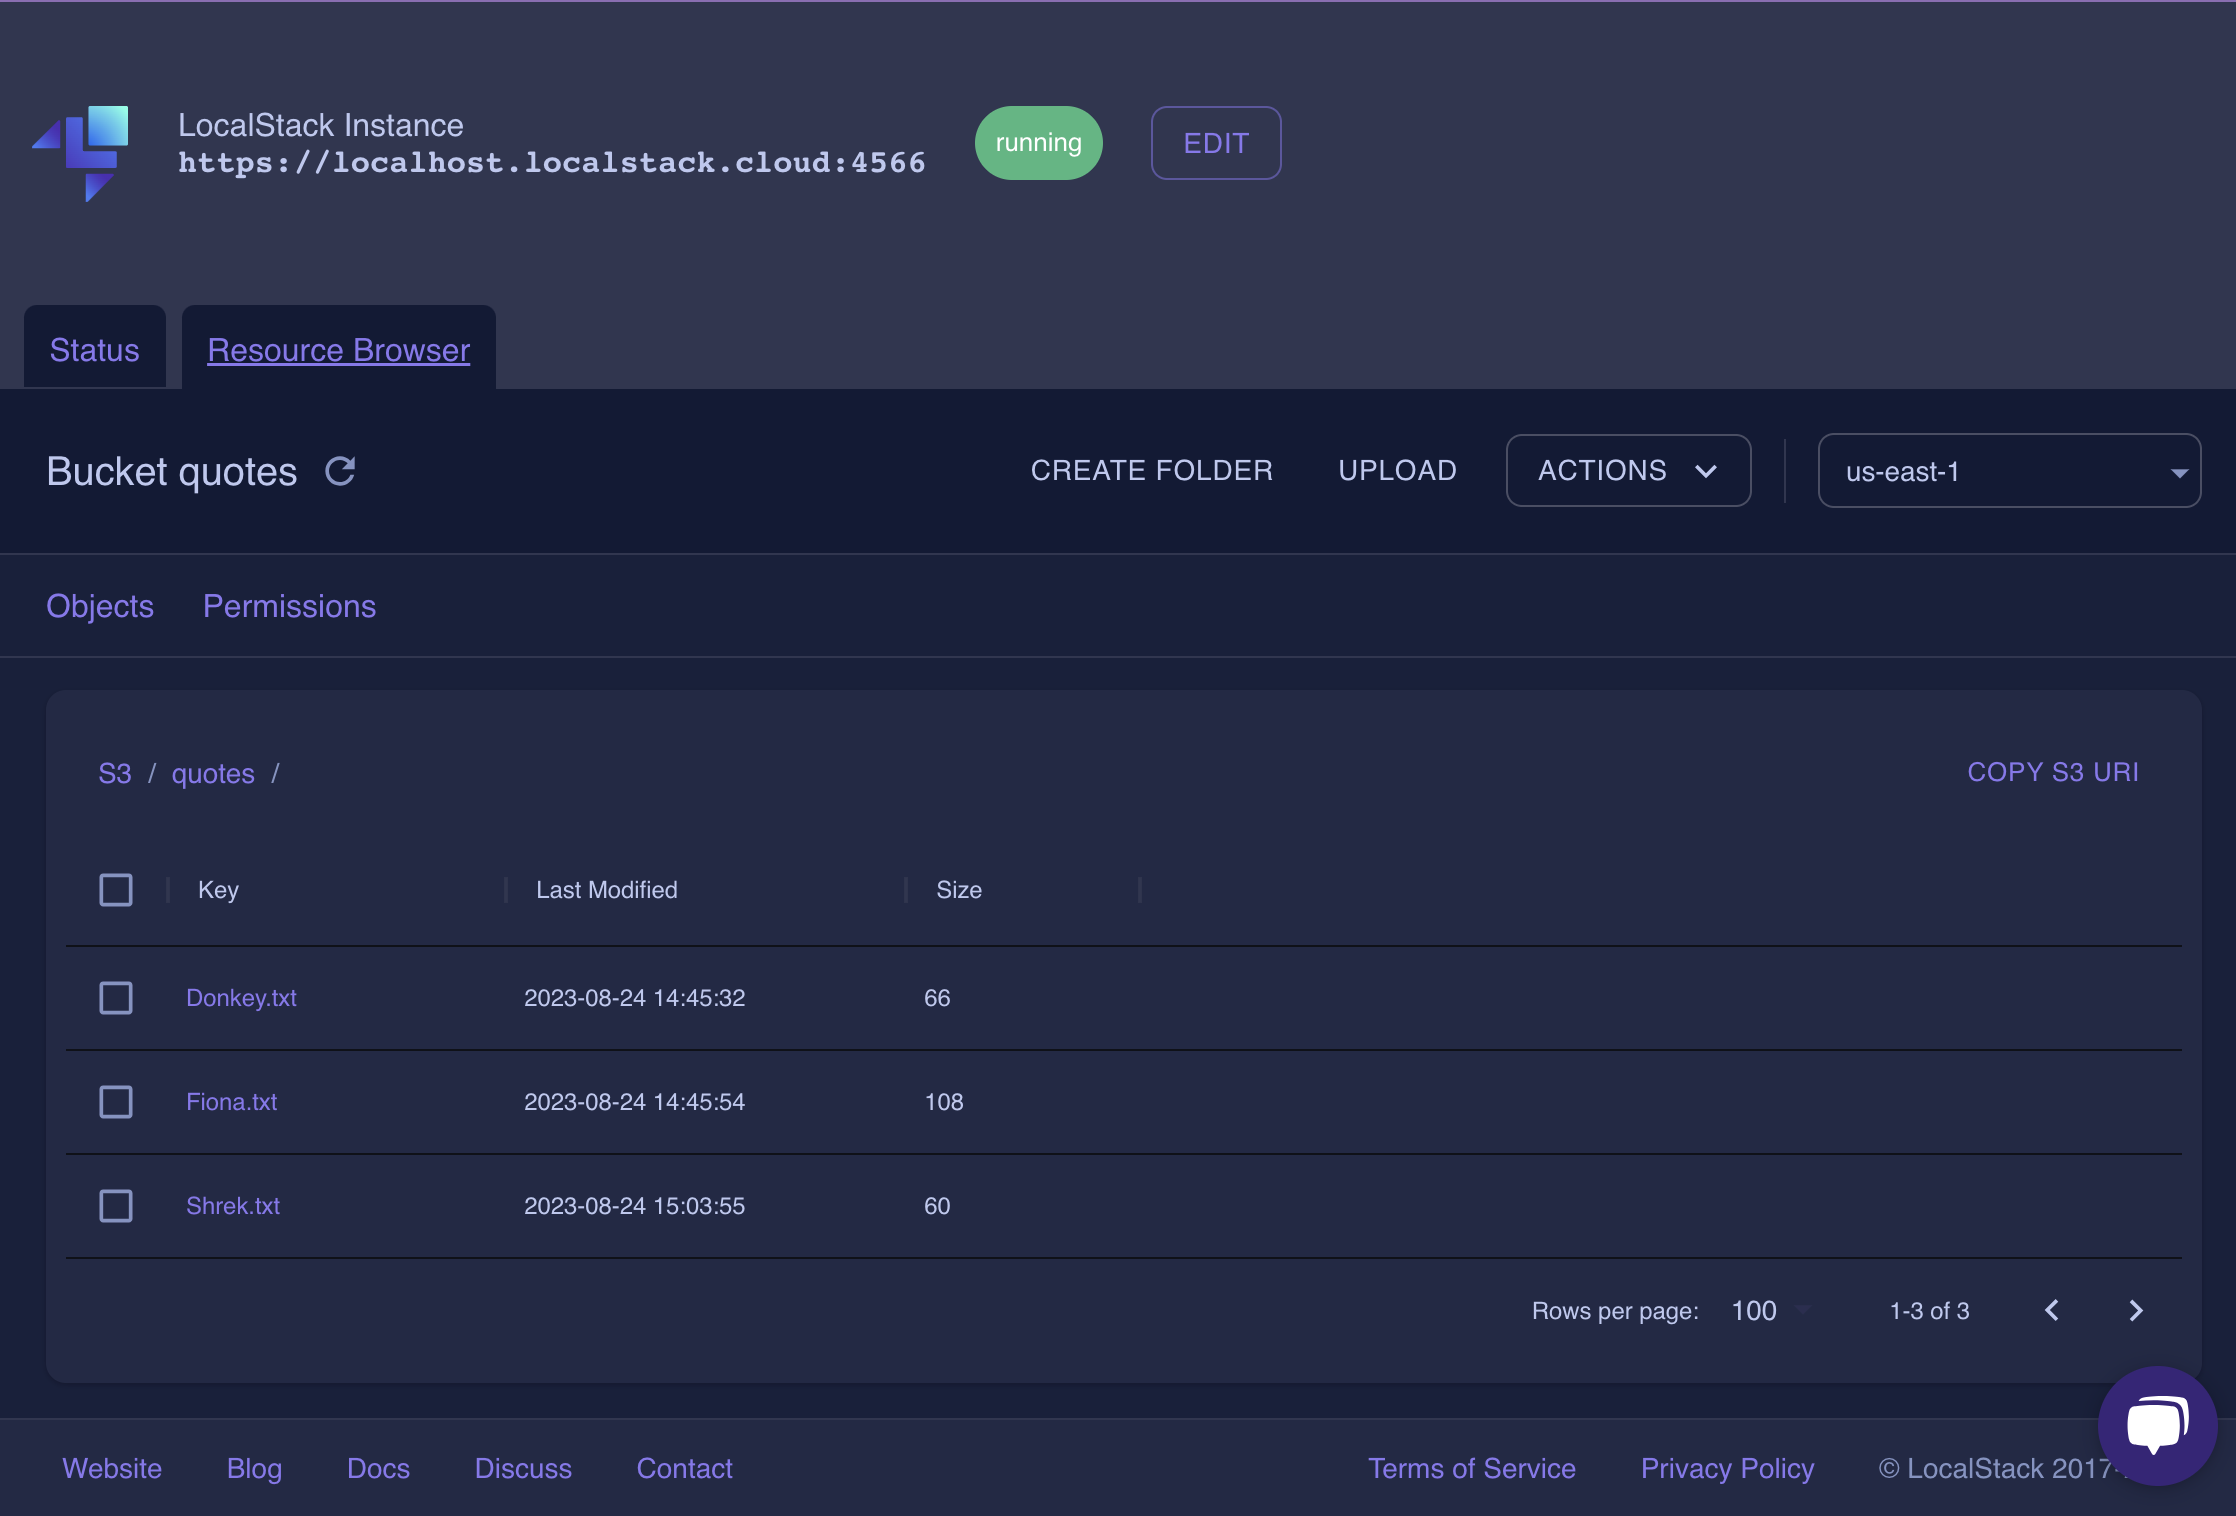
We’re not done yet. From here, you can dive into individual services and see all the nooks and crannies of your stack. In our example, we can see that all the quotes of our beloved characters are there, stored neatly, as individual text files:
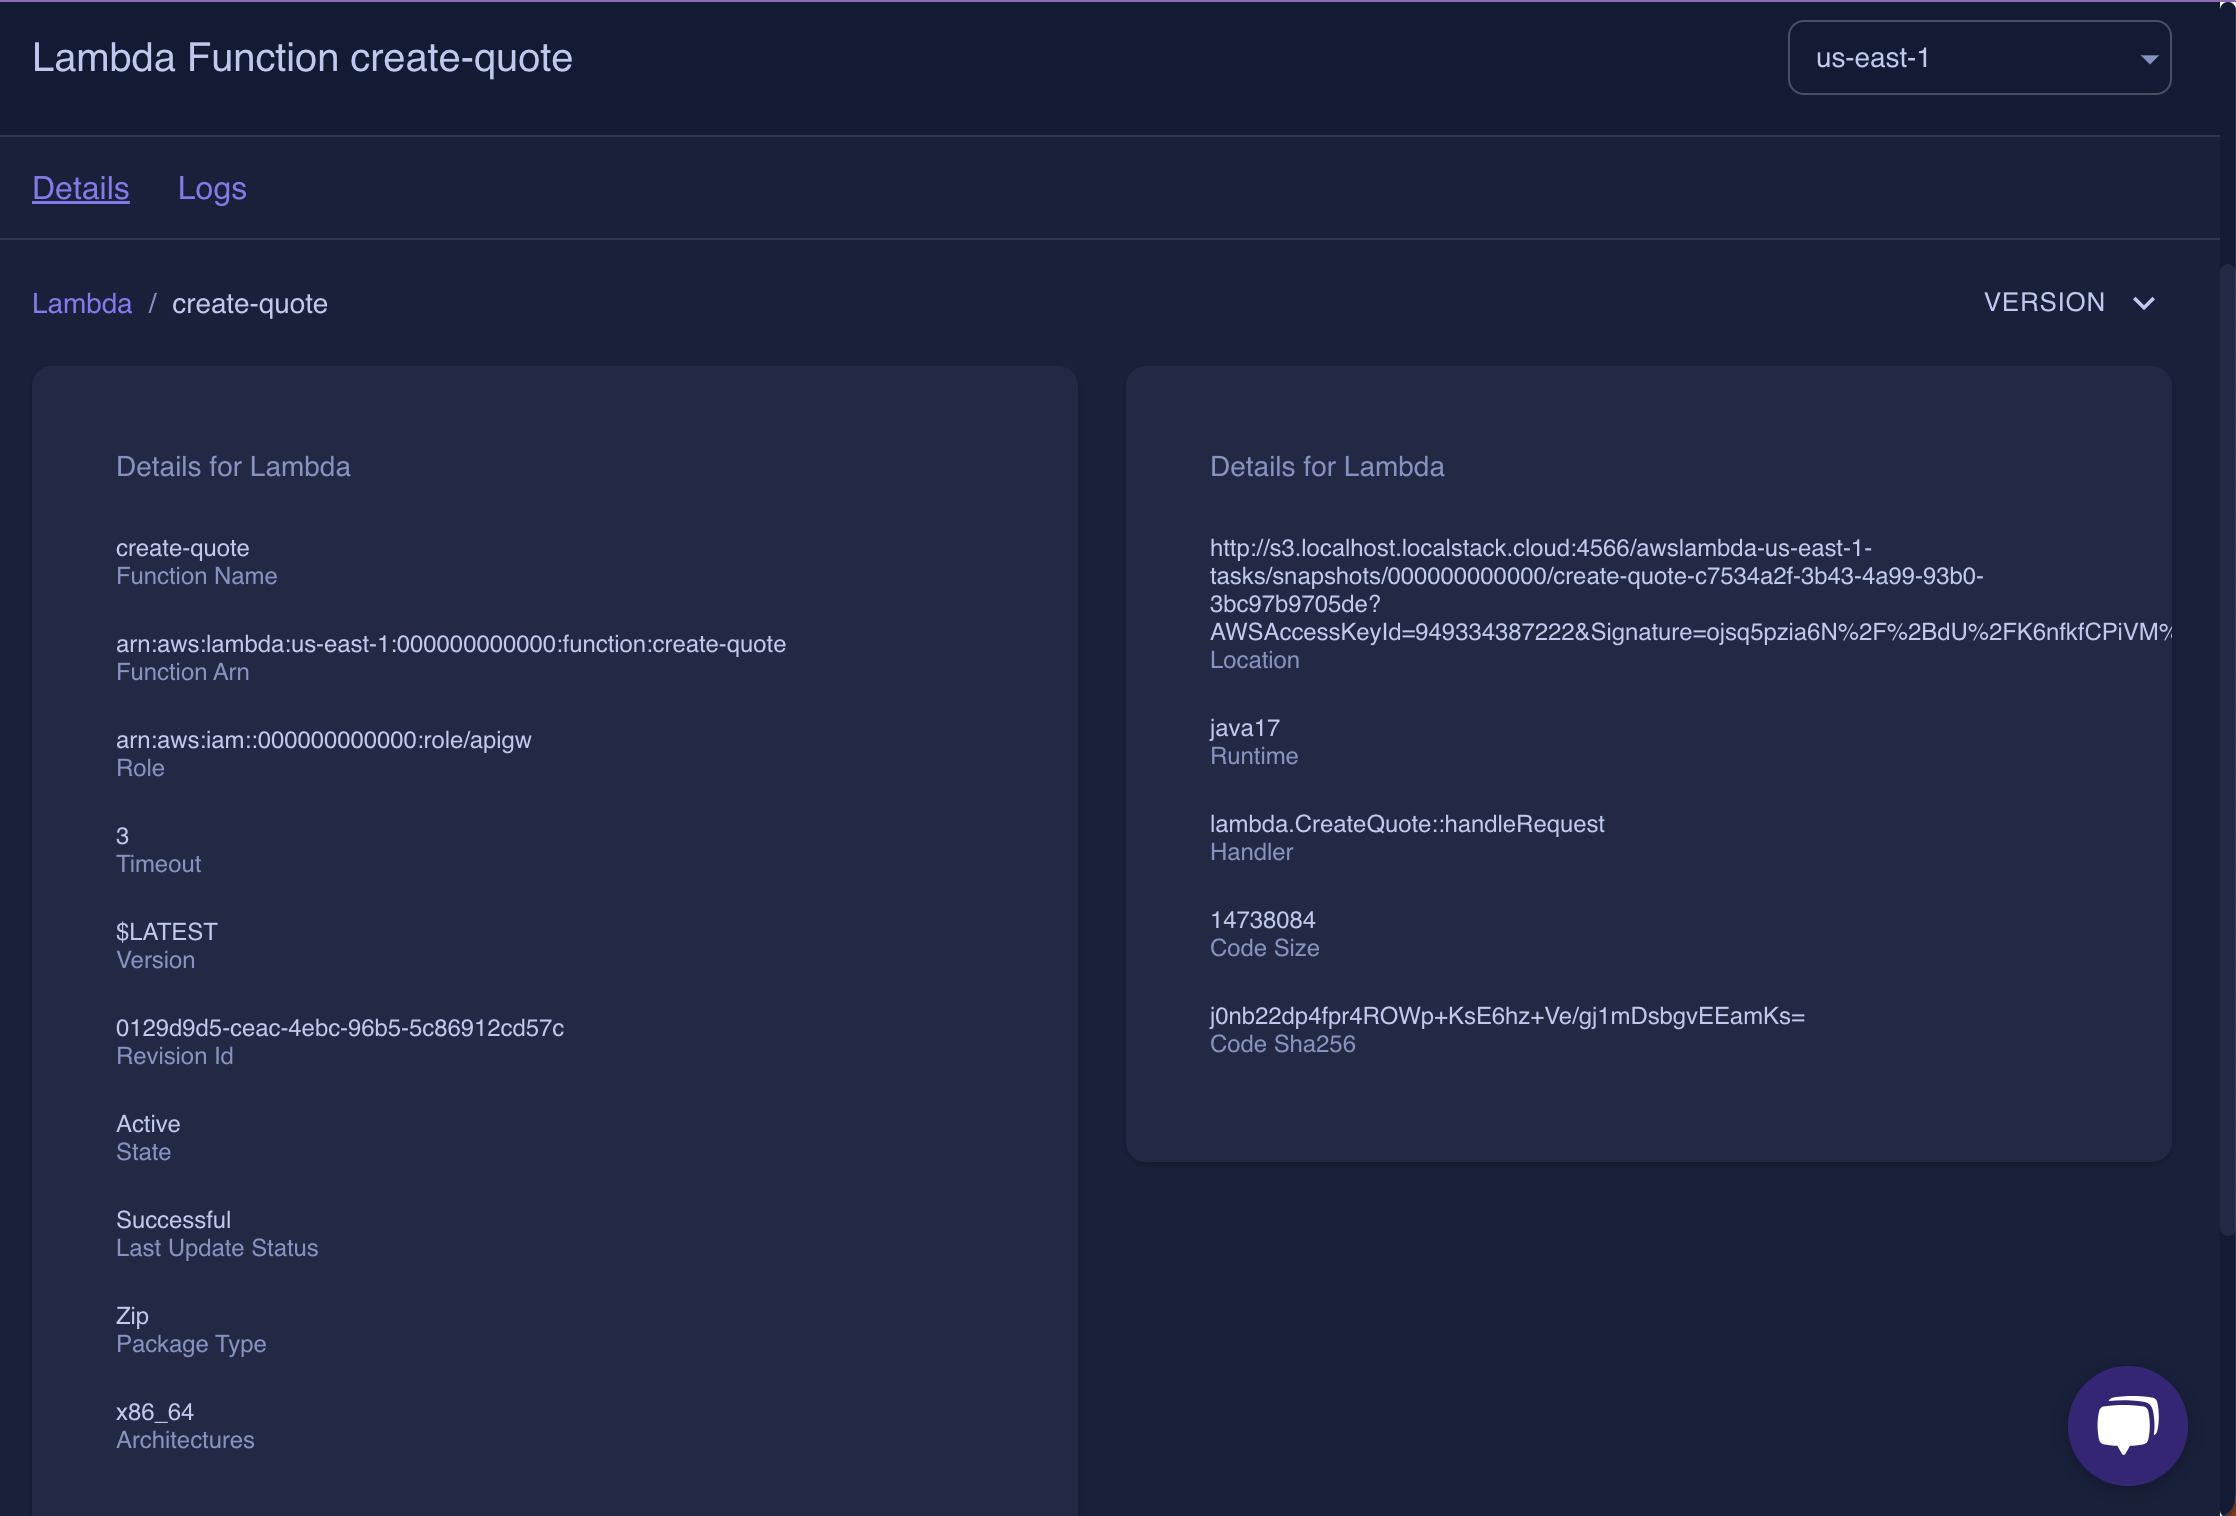
Let's talk about those Lambdas, shall we? They're not just functions anymore; they're practically an open book here, revealing all their configurations.
Hopefully, this incursion in pictures will encourage you to explore even more services and options in the LocalStack web application, and in the meantime, you can check out the docs.